The Analytics menu
This menu contains a series of tabs to view and analyze the bot's use cases, configurations, stories, and intentions.
The Monitoring menu allows you to track and observe connected users and conversations.
The Activity tab
This screen allows you to track different indicators over time:
- Number of messages received by the bot
- Messages per Story,
- Messages per Configuration,
- Messages per Connector,
- Etc.
A calendar allows you to define the time period to be viewed.
Each indicator can be viewed in several ways:
- Histogram
- Pie chart (over the selected period)
- Sortable table
- CSV export
The Preferences tab allows you to create your own dashboard, choose your indicators, and presentation options.
The Behavior tab
This screen presents other indicators for a defined period, without representing their evolution:
- Type of messages received by the bot
- Most used channels
- Hourly traffic
- Traffic by day of the week
- Etc.
A calendar allows you to define the period of time to be viewed.
Each indicator can be viewed in several ways:
- Pie chart (over the selected period)
- Sortable table
- CSV export
The Preferences tab allows you to compose your own dashboard, choose your indicators and presentation options.
The Flow tab
This screen allows you to analyze the flow of intentions and conversations:
-
Conversation flow (Dynamic / User Flow): dynamic analysis of the paths actually taken by users
-
Intention flow (Static / Available Stories): static analysis of the paths and decision trees proposed by the bot
By expanding the interface (arrow to the right of the frame), many filters appear: focus on an intention, incoming/outgoing transitions, all transitions or only the most representative in terms of traffic, etc.
The Users tab
This tab allows you to see the last users connected to the bot:
- Number of connected users
- Date of the last exchange with a user
- Last message sent
- Etc.
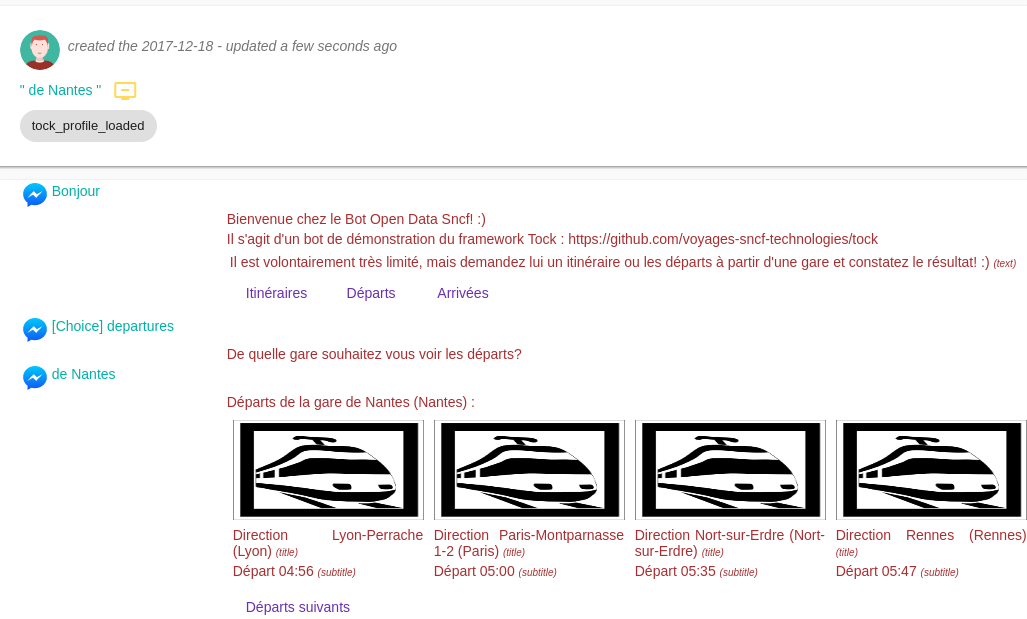
By clicking on Display dialog, you can see this user's conversation.

The Search tab
Like the Users view, this screen allows you to observe the latest conversations.
It is possible to filter them by connector, intention, etc.
The Preferences tab
This screen allows you to configure the dashboards of the Activity and Behavior views, both the indicators/graphs to display but also different presentation options: 3D diagrams, curve smoothing, etc.
An action allows the user to save their preferences.
Continue...
Go to Menu Model Quality for the rest of the user manual.
You can also go directly to the next chapter: Development.

 Chat with Tock