The Analytics menu
This menu contains a series of tabs to view and analyze the bot's use cases, configurations, stories, and intents.
The Activity tab
This screen allows you to track different indicators over time:
- Number of messages received by the bot
- Messages per Story,
- Messages per Configuration,
- Messages per Connector,
- Etc.
A calendar allows you to define the time period to be viewed.
Each indicator can be viewed in several ways:
- Histogram
- Pie chart (over the selected period)
- Sortable table
- CSV export
The Preferences tab allows you to create your own dashboard, choose your indicators, and presentation options.
The Behavior tab
This screen presents other indicators for a defined period, without representing their evolution:
- Type of messages received by the bot
- Most used channels
- Hourly traffic
- Traffic by day of the week
- Etc.
A calendar allows you to define the period of time to be viewed.
Each indicator can be viewed in several ways:
- Pie chart (over the selected period)
- Sortable table
- CSV export
The Preferences tab allows you to compose your own dashboard, choose your indicators and presentation options.
The Flow tab
This screen allows you to analyze the flow of intents and conversations:
-
Conversation flow (Dynamic / User Flow): dynamic analysis of the journeys actually taken by users
-
Intent flow (Static / Available Stories): static analysis of the journeys and decision trees proposed by the bot
By expanding the interface (arrow to the right of the frame), many filters appear: focus on an intent, incoming/outgoing transitions, all transitions or only the most representative in terms of traffic, etc.
The Users tab
This tab allows you to see the last users connected to the bot:
- Number of connected users
- Date of the last exchange with a user
- Last message sent
- Etc.
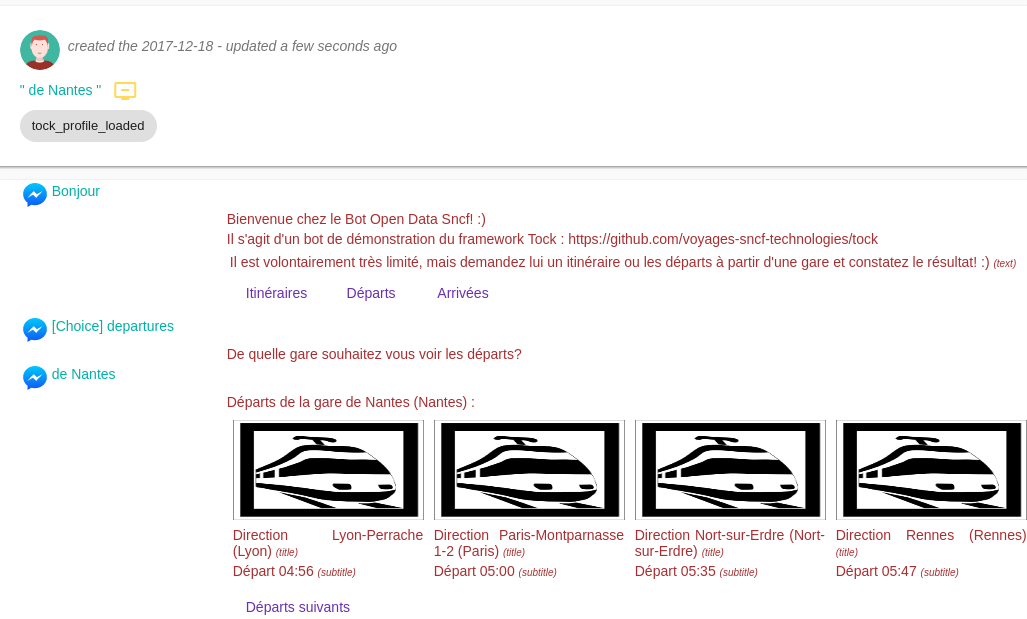
By clicking on Display dialog, you can see this user's conversation.
The Dialogs tab
This tab lists the latest dialogs of the bot. Each dialog can be displayed in full, with the details of each exchange (intent, NLU scores, RAG answer and its sources...).
The search options filter the dialogs by:
- text of the user questions (partial or exact match),
- period, configuration, connector, intent (or hide some intents), dialog ID,
- RAG answer status (for instance, questions answered with or without relevant documents),
- user feedback,
- dialogs held from the Tock Studio test view,
- dialogs containing RAG answers,
- annotations: annotated dialogs only, annotation state and reason, annotation creation date.
From a bot answer, shortcuts open the question in the playground or in the retrieval diagnostic, with the values recorded for this exchange.
Annotations
An annotation reports and follows an issue on a bot answer. Open the annotation of an answer to set:
- its state: Opened, Review needed, Resolved or Won't fix,
- its reason: question not/misunderstood, inaccurate answer, incomplete answer, incomplete sources / documents, obsolete sources / documents, business lexicon problem, wrong answer format, hallucination or other,
- a description, and the ground truth (the expected answer).
Comments can be added, and every change is kept in the history of the annotation. Annotated dialogs can then be found with the annotation filters.
The Satisfaction tab
The satisfaction module lets users rate their experience with the bot. When it is not active, the tab offers to activate it: 4 stories are then created, and users can rate the bot, for instance by asking "Rate your experience".
Once activated, the tab lists the rated dialogs with the average rating, and they can be exported.
The Preferences tab
This screen allows you to configure the dashboards of the Activity and Behavior views, both the indicators/graphs to display but also different presentation options: 3D diagrams, curve smoothing, etc.
An action allows the user to save their preferences.
 Chat with Tock